
I’ve become a lot more suspicious of statistics that look current simply because the page around them is current. Here’s the process I now use before a number makes it into anything I publish.
Many a time, I have spent an embarrassing amount of time chasing statistics around the internet. You find a number that fits what you’re researching, the article looks recent, and there is a source attached to the claim, so you assume you’re probably one click away from the original research. Then you click.
The “source” is another article.
You open that one, find its citation, and click again. Sometimes there is another article after that. And another. By the time you eventually reach the organization that actually produced the number, a few different things may have happened:
- the statistic is several years older than the page you found it on;
- the original study measured a much narrower group than the article now suggests;
- the wording has shifted from something like “tried” to “regularly uses”;
- the original methodology adds context that changes how impressive the number looks; or
- you get to the supposed source and the statistic is simply not there.
That has changed how I research statistics posts a lot, because finding the number is no longer the research to me. It is really just the lead. The research starts when I try to prove where the number came from, what it actually measures, whether the source is current enough for what I’m writing, and whether I can defend the way I’m using it.
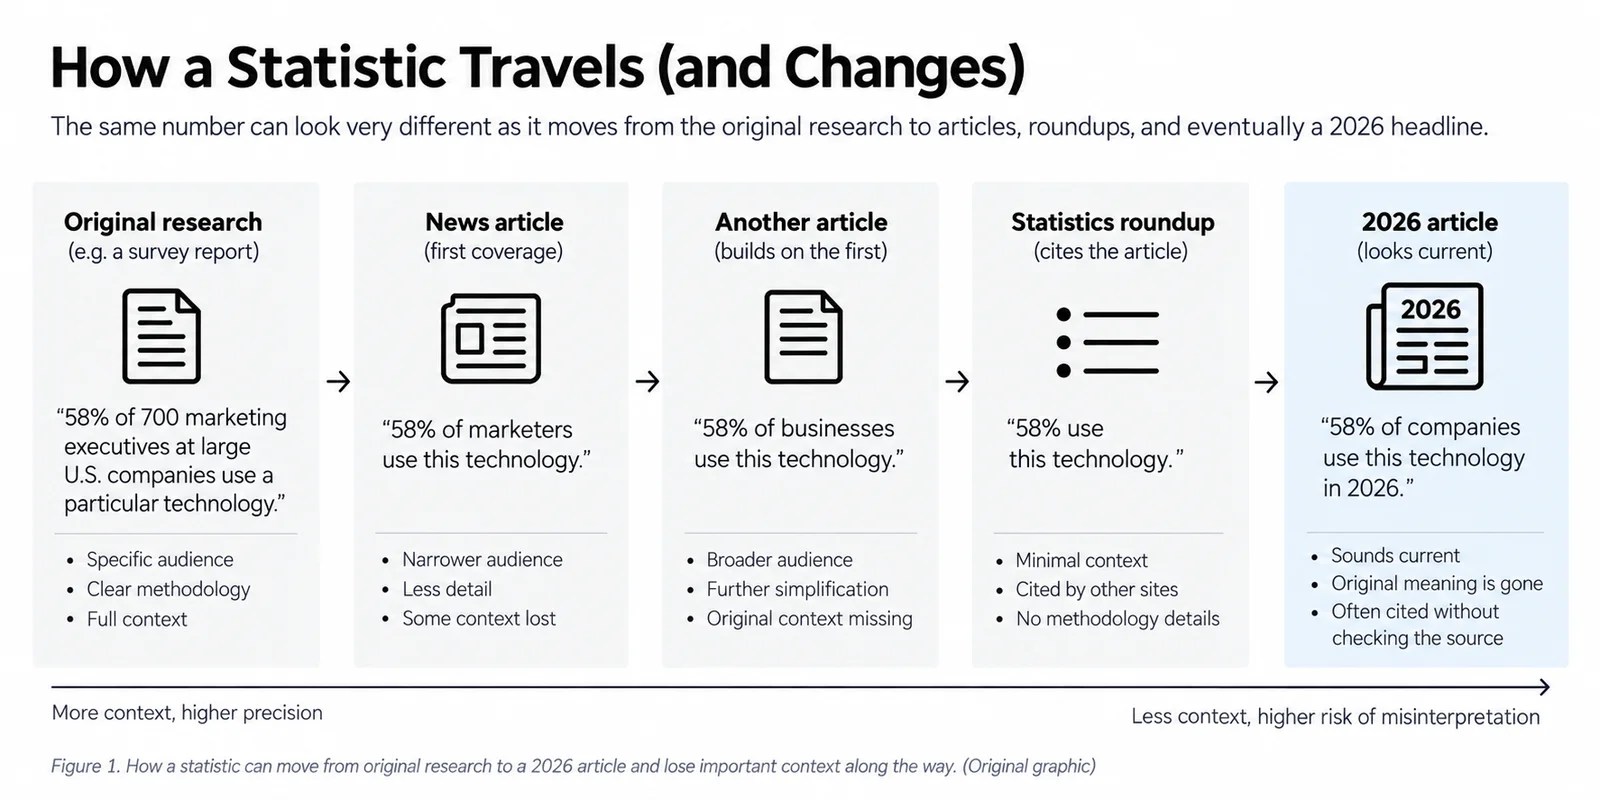
Original graphic. How context can drift as a statistic moves from the original research through secondary coverage.
A number can stay the same while its meaning changes
A lot of statistics online are probably not completely made up. What I run into more often is context getting shaved off as a number moves from one page to another.
Imagine an original survey finds that 58% of 700 marketing executives at large U.S. companies use a particular technology. Another article summarizes that as “58% of marketers.” Someone else cites that article and turns it into “58% of businesses.” A statistics roundup picks up the claim, another roundup cites that roundup, and eventually you find the same number sitting inside a page with “2026” in the title.
The percentage has survived perfectly. The meaning hasn’t.
That is also why I’m careful with phrases that sound close enough to be interchangeable. Depending on the study, any of these could describe different things:
- people who have tried an AI tool;
- people who use one at least occasionally;
- people who use one every day;
- people who use AI specifically for search;
- people who say AI has replaced some of their traditional search behavior.
If the original research measured the first one, I don’t want my article quietly turning it into the fifth one because that makes for a better headline.
I check the publication date and the data date separately
This is probably the easiest way for a genuinely current report to get described imprecisely. A report can be published in 2026 and still be based on fieldwork from late 2025. There is nothing wrong with that. Research takes time to analyze and publish. I just want to be precise about which date refers to what.
A good example is McKinsey’s Global Tech Agenda 2026. McKinsey published it on February 9, 2026, but the methodology says the online survey was in the field from September 29 to November 10, 2025. The survey had 632 respondents across 69 countries and 24 industries and subindustries.
McKinsey Global Tech Agenda 2026
Published February 9, 2026
Fieldwork September 29–November 10, 2025
Sample 632 respondents
Scope 69 countries, 24 industries/subindustries
Source: McKinsey & Company, Global Tech Agenda 2026. The report was published in 2026; the survey responses were collected in 2025.
I can still use research like that in a 2026 statistics post if my rule is “published in 2026.” What I should not do is say 632 people reported something “in 2026” when those people actually answered the survey in late 2025.
It sounds like a tiny distinction until you start comparing studies, tracking changes over time, or building an annual reference page where recency is part of the promise.
For the statistics pages I’m building now, my rule is stricter
We’re already heading toward 2027, so I don’t particularly want to publish a “2026 statistics” page that is mostly 2024 and 2025 data wearing a fresh title. For the current batch of statistics posts I’m working on, the substantive numbers need to come from primary research published in 2026.
If a 2026 report used 2025 fieldwork, I’ll preserve that detail. That gives me a clean publication-year standard without pretending the measurement itself happened later than it did.
What I actually mean by a primary source
My rule here is fairly simple: I want to get as close as possible to whoever actually generated the data.
So if Pew Research Center ran the survey, I want the Pew report. If a company analyzed data from its own platform, I want that original analysis. If an academic team conducted the study, I want the paper. If a government agency collected the dataset, I want the agency’s release or database rather than an article summarizing what the agency supposedly found.
Secondary sources are still useful for discovery. Sometimes a great article is how I learn that a study exists in the first place. I just don’t want my trail to end there.
My quick primary-source test
Did this organization produce the evidence behind the number, or are they telling me what somebody else found?
If they produced it, I start checking the methodology. If they are quoting somebody else, I follow the citation and keep going.
Company research can still be primary research
I also don’t think “primary source” automatically means government or academia. A company analyzing a large dataset it actually owns can be the primary source for that analysis. The same goes for a research firm conducting its own survey or a software platform publishing aggregate data from its product.
I still want to know how the study was designed and what incentives sit around it, obviously. A vendor having a stake in the topic matters. But useful first-party data does not suddenly become secondary just because a company produced it.
My verification process before a statistic makes the cut
Once I find a promising number, I basically start interrogating it. I don’t need every article to turn into an academic literature review, but there are a few things I want to know before I’m comfortable putting the statistic on a page someone else might cite.
- Who actually produced the number? I keep following citations until I reach the original report, dataset, study, survey, filing, research page, or official release.
- When was it published? For the current statistics library, that means 2026.
- When was the data collected? I look for fieldwork dates, measurement windows, crawl dates, query dates, or whatever period makes sense for the research.
- Who or what was measured? Consumers, B2B buyers, marketers, executives, websites, queries, sessions, domains, and citations are all different populations.
- How large was the dataset? Sample size does not decide quality by itself, but it tells me a lot about what kind of claim the study can support.
- What exactly does the percentage measure? This is usually where superficially similar statistics stop being comparable.
- What does the methodology say that the headline doesn’t? Weighting, geography, exclusions, definitions and study design can change how I interpret the result.
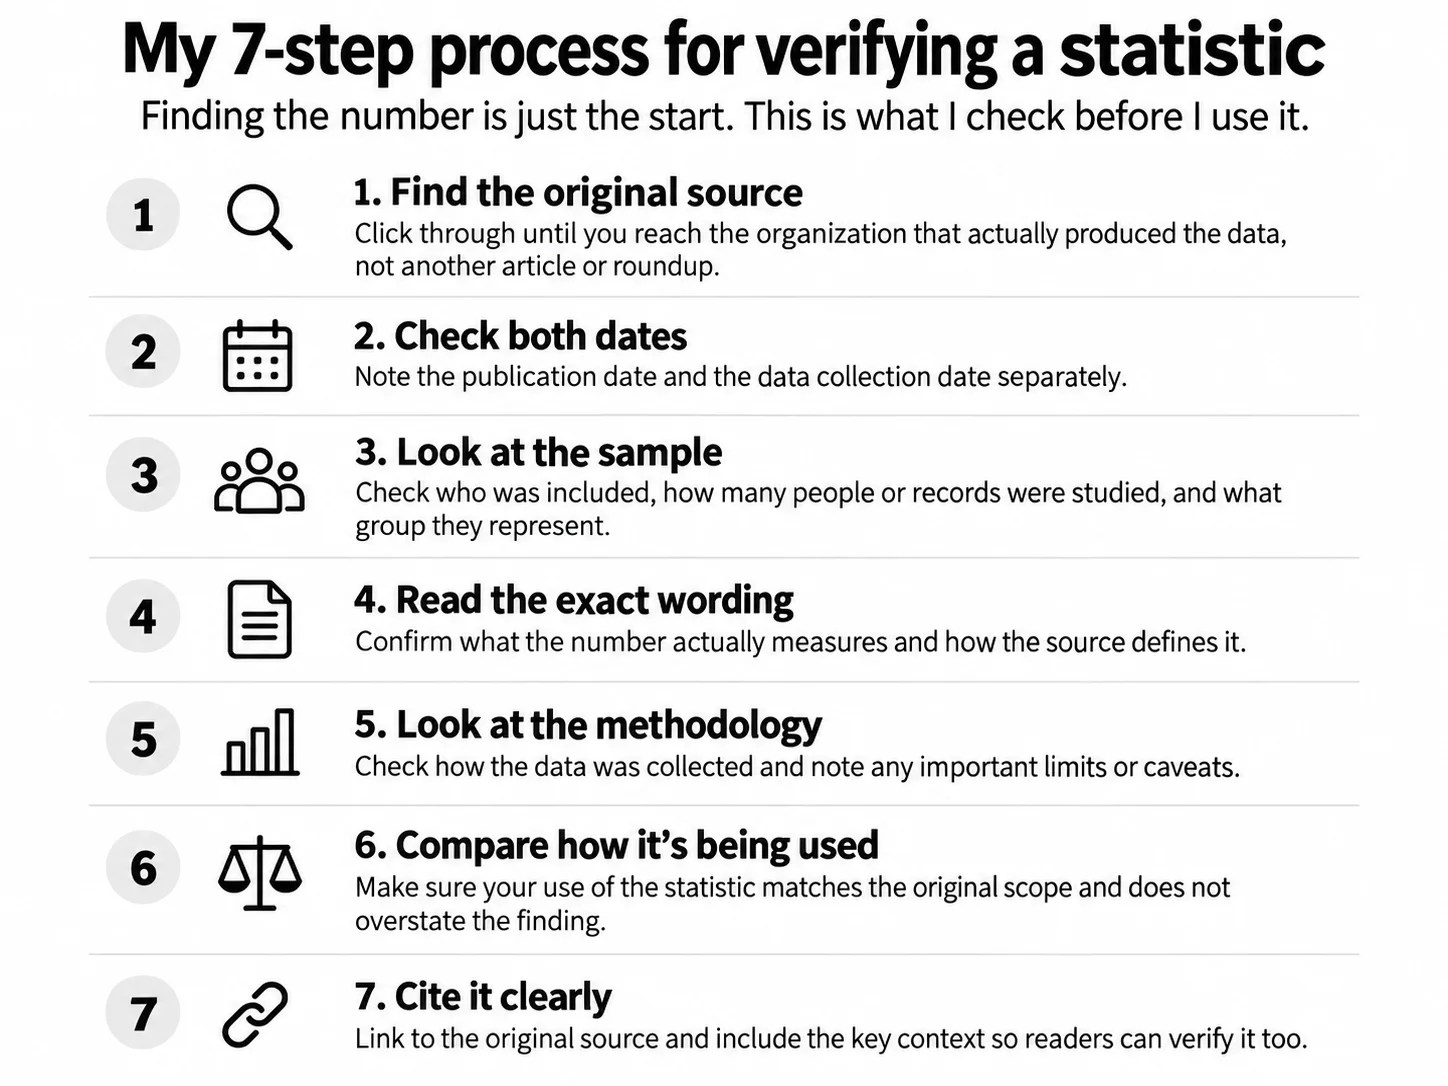
Original graphic. My seven-step check before I cite a statistic.
Scope is where I think a lot of stats posts go wrong
A huge dataset can be incredibly useful and still be the wrong evidence for the claim you want to make. An analysis of millions of consumer searches can tell us a lot about search behavior generally, for example, while telling us very little specifically about how B2B SaaS buyers research software.
This is something I’m watching closely in the AI search and generative engine optimization research I’m working on now. There are plenty of interesting numbers about ChatGPT, Google AI Overviews, Perplexity, AI referral traffic and AI citations. That does not automatically make all of them “B2B SaaS statistics.”
If the source studied the broader web, I’d rather say that clearly and then explain why the finding might matter to B2B SaaS than quietly change the population because the narrower framing fits my article better.
And similar-sounding metrics can still be completely different
This becomes especially messy with AI search because there are several layers that people sometimes collapse into one conversation:
- adoption: whether people or organizations use the technology at all;
- usage frequency: how often they use it;
- visibility: whether a brand or domain appears in an AI-generated result;
- citations: whether the system explicitly cites a source;
- referral traffic: whether somebody actually clicks through to the site; and
- conversion: what those visitors do after they arrive.
You can have strong growth in one layer and barely any movement in another. That is why I don’t want to put two percentages beside each other simply because both contain the words “AI search.”
Sometimes the correct result of the research is deleting the number
This is probably the biggest change in how I approach statistics content. I used to think a better statistics page meant collecting more statistics. Now I care much more about how many of those numbers I can actually defend.
I’ll usually drop a statistic when:
- I cannot locate the original research;
- the supposed source exists, but the statistic is not actually there;
- the underlying data is too old for the page I’m building;
- I cannot work out who or what the number describes;
- a key definition has disappeared somewhere along the citation chain;
- the methodology makes the number unsuitable for the claim I wanted to make; or
- dozens of sites repeat the statistic, but every citation eventually loops back to another secondary page.
That last one is especially funny because repetition can make a statistic feel extremely established. You search for it and see the same number everywhere, so surely somebody must have checked it. Then you start opening the citations and realize half the internet is effectively citing the other half.
I’d rather publish 27 statistics I can trace cleanly than force a page to “100+ statistics” because the bigger number looks better in a title.
The analysis gets better once I know what I’m actually comparing
This is the part I care about beyond just having clean citations. Verifying the source, scope and methodology lets me compare the evidence without accidentally comparing different things.
Say one 2026 dataset shows AI referral traffic growing by several hundred percent, while another shows AI referrals still account for a tiny share of total website traffic. I don’t immediately see a contradiction there. Something can grow very quickly from a tiny base and still remain small in absolute terms.
The same thing applies to adoption and usage. One study could show a lot of people have experimented with AI search while another shows much lower daily usage. Again, both can be true. Trying something and building it into your normal behavior are different measurements.
I prefer to analyze clusters of evidence
For the actual statistics pages, I want the numbers to stay easy to find. Somebody who landed on the page because they searched for one statistic should not have to dig through a mini essay after every bullet.
So the structure I’m moving toward is fairly simple:
- put the strongest statistics near the top;
- give readers a master table they can scan quickly;
- group related statistics into useful sections;
- then step back after each cluster and look at what the group of findings actually suggests.
That is where I can start asking the questions I actually find interesting: Do independent datasets point in the same direction? Are two studies disagreeing because they measured different populations? Is the giant growth percentage mostly a base-effect story? Does visibility turn into citations? Do citations turn into clicks? Do clicks turn into anything useful?
And if the evidence cannot answer one of those questions yet, saying that is useful too.
There is still a line between inference and making up a story
If 22% of respondents did something, I can say roughly one in five did it. I can say about 78% did not. If another genuinely comparable group is at 44%, I can quantify the difference between them.
What I cannot do is decide the other 78% “don’t trust the technology” unless the study actually asked them why. There could be a dozen explanations, and the percentage by itself does not tell me which one is true.
The same goes for causality. Two things moving together can be worth pointing out, but I don’t want to quietly turn correlation into a causal story because it makes the analysis sound smarter.
So yes, fewer statistics.
I still want these pages to be very easy to use. If someone Googles a statistic, lands on one of my pages, and only needs the number and the source, they should be able to get both quickly. The table should work. The attribution should be obvious. The original research should be one click away.
Underneath that simple surface, though, I want the research process to be annoyingly rigorous. I want to know where the number came from, when the evidence was collected, who was measured, what the metric actually means, and what the methodology allows me to say about it.
Sometimes that process gives me a better statistic. Sometimes it gives me a more interesting comparison. And sometimes, after opening eight tabs and spending 20 minutes trying to verify one sentence, it tells me to delete the damn number.
That counts as useful research too.