Updated October 11, 2026. How much should a B2B SaaS company budget for content marketing? It depends on whether you are hiring someone to write articles, asking an agency to run part of your content program, or putting a full-time writer on payroll. The invoices can look similar while the work included is entirely different.
32% of B2B marketers in CMI’s research named owned media among their top three planned 2026 investments, compared with 19% for agency and outsourcing spend (CMI/MarketingProfs).
These values come from different populations and billing units. An EFA survey rate is not an agency retainer, an advertised agency package is not a paid invoice, and a U.S. employment median is not a SaaS-specific salary.
How much does freelance B2B SaaS writing cost?
The EFA’s 2026 Rate Chart is based on a survey conducted from November 2025 through mid-January 2026, with more than 1,100 respondents reporting what they charged during 2025. Under work-for-hire blog posts, the published median-rate range is 25–45 cents per word. Blog ghostwriting is shown separately at 25–40 cents per word.
Those are rates among responding editorial professionals, not mandatory rates, not an average of every writer in the world, and not a B2B SaaS-only sample. Actual quotes can be higher or lower depending on subject expertise, turnaround time, technical product testing, interviews, research and whether the fee includes revisions.
Business and marketing writing is a separate rate category
The Editorial Freelancers Association’s chart does not use one catch-all rate for all commercial writing. Respondents categorized blog posts and business/marketing assignments separately, and it also distinguishes work for hire from ghostwriting. These categories are potentially relevant to SaaS commissioning, but none is a statistically representative sample of B2B SaaS writers alone.
The published per-word and hourly ranges are alternative billing observations from survey respondents, not figures to add together or a conversion showing the same person’s earnings. Response counts varied by question. For a real proposal, first specify who owns product testing, original interviews, fact-checking, editing, revisions, screenshots and publishing; a billing rate without scope remains an incomplete comparison.
What the per-word benchmark looks like per article
Article length
At $0.25/word
At $0.45/word
1,000 words
$250
$450
1,500 words
$375
$675
2,000 words
$500
$900
2,500 words
$625
$1,125
Illustrative calculations using EFA’s reported range, not a survey of completed B2B SaaS projects. The totals assume writing alone is priced by word.
A comparison article that requires a writer to sign up for five products, test features, capture screenshots, review pricing and interview customers can take much more work than an article of the same word count compiled from existing documentation. That’s why two 2,000-word articles can have materially different project fees.
When assessing a freelance quote, ask what research, interviews, product access, screenshots, briefs, editing and revision rounds are included. A cheaper first draft may create a larger editing burden for your content lead.
How much does an agency charge for content marketing?
Content Marketing Services analyzed 291 public offers from 122 agencies in a study published in September 2026. Of these, 167 advertised fixed or starting prices. For a comparable cohort of monthly SEO content packages, the median was $2,500 across 19 offers from 10 agencies, with published prices ranging from $850 to $10,000. Monthly content strategy packages had a $3,000 median across 18 offers from 10 agencies and ranged from $1,500 to $10,000.
These medians tell us what agencies publicly advertised, not the average amount a SaaS company ultimately pays. The packages can include different services, and agencies that never publish prices are not fully represented by the priced cohorts.
In fact, a second agency package scope study coded 769 stated deliverables from 211 public packages across 70 agencies. Content and creative production appeared in 150 packages, or 71%. The wording of public packages was less consistent about other services, including measurement, planning and distribution. A missing feature in the advertised package is not proof an agency never provides it.
What the agency pricing sample actually contains
The published offer counts are as important as the package medians. The agency study recorded 291 public offers from 122 agencies during August and September 2026. Only 167 offers, or 57%, disclosed a fixed or starting price in U.S. dollars. Another 79 offers were explicitly free, and 45 required a custom quote. A free consultation is a different purchase category from a monthly content retainer.
The SEO-content median comes from only 19 offers across 10 agencies. The content-strategy median comes from 18 offers across 10 agencies. A small, selectively published package sample should not be presented as the typical realized cost of hiring an agency, and it does not establish the market rate for specialist B2B SaaS writing.
How clearly do public agency packages define their scope?
In a separate coding study, Content Marketing Services reviewed 211 publicly advertised packages from 70 agencies, classifying 769 stated deliverables. This measured what package pages explicitly promised, not what agencies ultimately supplied under contract.
The categories overlap, and an omission from the public package description does not prove the agency cannot provide that service. Still, the numbers show why a buyer should ask for concrete deliverables, review responsibilities and measurement terms in the proposal before comparing monthly fees.
Why the retainer price alone is misleading
A $2,500 monthly package could mean several written articles, or it could mean a broader SEO engagement where content is only one deliverable. Ask for an itemized proposal with the expected output, research depth, approval process, editorial ownership, performance reporting and any technical SEO work clearly stated.
The U.S. Bureau of Labor Statistics reports a median annual wage of $76,910 for writers and authors in May 2025, while editors had a median of $77,920. These figures were published in the current 2026 occupational outlook data.
They cover employed workers across several industries, not only SaaS content marketers, and represent wages rather than total employer costs. Hiring a full-time employee adds expenses such as benefits, payroll-related obligations, tools, equipment, management time and recruitment. Therefore, a $76,910 wage should not be entered as the entire cost of running a content function.
This is an all-industry average, not the compensation structure of SaaS writers or a multiplier you can automatically apply to the writers-and-authors median salary. The two surveys cover different populations and report different summary statistics. For a specific hire, use the actual proposed salary, employer contributions, benefits, software costs and anticipated management time.
On the other hand, an internal writer can gain deeper access to product managers, customers, support tickets and company strategy. That can reduce the time spent rebuilding context on every assignment. Whether that justifies a hire depends on expected volume and the availability of someone to manage content.
A better way to compare freelancer, agency and in-house costs
Instead of comparing an article fee against a monthly salary, calculate the fully scoped cost of the output your team needs. A useful comparison includes:
Production: written articles, landing pages, case studies or original research deliverables.
Research: product testing, customer or expert interviews, data verification and source collection.
Editorial: briefs, editing, fact-checking, revisions and approval management.
Design and publishing: charts, screenshots, CMS formatting, images and on-page optimization.
Distribution and measurement: newsletters, social repurposing, reporting, refreshes and sales enablement.
Now compare the cost of achieving that same scope through each model. If the team needs only two specialist comparison articles each month, a freelancer can be straightforward to coordinate. If it needs strategy, five formats, multiple approvals and routine distribution, the wider operating system may matter more than the unit cost of a single article.
Sample planning budgets, not market-rate claims
The following are hypothetical planning calculations to illustrate how a scope changes cost. They are not survey averages or forecasts.
Example workload
Calculation
Illustrative writing cost
2 articles at 1,500 words
3,000 words × $0.25–$0.45
$750–$1,350
4 articles at 1,500 words
6,000 words × $0.25–$0.45
$1,500–$2,700
6 articles at 2,000 words
12,000 words × $0.25–$0.45
$3,000–$5,400
Those examples exclude paid research, design, editing, distribution and other tasks if separately billed. They show why a useful budget begins with deliverables and scope rather than a vague instruction to “publish more content.”
Methodology and limitations
This reference uses original sources available by October 11, 2026. The Editorial Freelancers Association surveyed more than 1,100 respondents about their 2025 editorial rates for its 2026 chart; each service category had a different number of responses. The agency pricing report analyzed publicly advertised offers reviewed in August and September 2026. Its page currently lists a September 1 publication date alongside an evidence window ending September 18, so those labels cannot both describe the data available on the initial publication date. Treat its findings as a living, retrospectively updated report and retain the evidence-window dates when citing it. The agency sample excludes private agreements and negotiated invoices. U.S. Bureau of Labor Statistics figures are median 2025 employment wages, not full employer costs or SaaS-specific compensation. Content Marketing Institute and MarketingProfs’ 2026 planning percentages come from 2025 fieldwork. All article-budget calculations are illustrations rather than observed contracts. None of these datasets isolates B2B SaaS writers, agencies or contracts as a statistically representative population.
Updated October 11, 2026. What should a B2B SaaS company expect from SEO in 2026? The answer depends on its age, brand demand, search footprint and the products it sells. A venture-backed category leader and a new vertical SaaS company should not be judged against the same traffic number.
This reference uses Ahrefs’ continuously updated research, including monthly Google Search Console measurements for June 2026. It provides broad baselines for Google organic clicks and sitewide click-through rates. These are cross-industry website benchmarks, not B2B SaaS-only averages. The published click-through-rate report also has an unresolved sample-size inconsistency, explained in the methodology below. Use these figures for context, not as universal SaaS targets.
Ahrefs states 422,421 sites in the CTR report’s overall sample, although its published Domain Rating subgroup counts do not reconcile with that total (Ahrefs, June 2026 measurement).
This table summarizes selected findings from separate Ahrefs traffic and click-through-rate samples. The figures are cross-industry medians, not measurements of B2B SaaS businesses specifically. They should not be paired as though they describe the same exact websites.
Domain Rating (DR) is Ahrefs’ proprietary measure of the strength of a domain’s backlink profile on a 0–100 scale. It is not a Google ranking factor and should not be treated as one. The following figures come from two separate Ahrefs analyses of website traffic and CTR for June 2026, grouped by DR.
Ahrefs Domain Rating
Median monthly Google clicks
Median sitewide Google CTR
0–10
9
0.39%
10–20
60
0.56%
20–30
133
0.60%
30–40
308
0.65%
40–50
831
0.78%
50–60
1,594
0.84%
60–70
3,630
0.97%
70–80
10,988
1.25%
80–90
50,292
2.27%
90–100
81,530
2.91%
Sources: Ahrefs’ organic traffic benchmarks and Ahrefs’ sitewide CTR benchmarks, measured for June 2026. The reports state different total sample sizes but reuse identical counts in the Domain Rating groups; the publicly presented data do not establish whether these group-level figures represent a fully matched cohort. Treat the two metrics as descriptive benchmarks, not paired observations.
It would be misleading to interpret the table as a promise that raising DR from 30 to 50 will automatically multiply clicks. Websites with more backlinks often also have older domains, more pages, established brands and higher navigational demand. Those factors move together, but the table cannot isolate which one caused additional clicks.
For B2B SaaS, the comparison also breaks down when brand awareness differs. A well-known product can earn a substantial volume of navigational clicks from its existing customer base. A new SaaS vendor can produce excellent nonbranded buying-intent content and still record far less total traffic.
Organic SEO benchmarks by website size
Website size also shapes benchmarks. Ahrefs grouped sites by their number of indexed pages. The resulting differences are large, even before considering conversion value or lead quality.
The practical lesson is to compare your site with organizations of a similar size rather than with the most visible SaaS brands in the category. However, having more URLs is not a strategy on its own. An archive of repetitive AI-generated pages can increase indexable page count without improving useful coverage or demand.
Industry benchmarks are not the same as SaaS benchmarks
One of the more common mistakes in SaaS SEO reports is borrowing statistics from broad technology categories, calling them “SaaS averages,” and setting growth targets from there. Ahrefs reports median monthly Google clicks of 25,683 for Internet & Telecom sites (378 sampled sites), 18,650 for Computers & Electronics (516 sites), and 8,232 for Business & Industrial (824 sites). These values come from its June 2026 industry table.
None of those categories represents only B2B SaaS companies. They include businesses with different products, distribution models, buyers and search demand. The figures are useful as broad context, not a basis for saying the “median SaaS company gets X clicks.”
Cross-industry traffic medians and the limits of industry labels
The industry’s name in a benchmarking study isn’t necessarily the company’s business model. Ahrefs published median Google Search Console clicks for 26 industry categories in June 2026. The selected groups below are sometimes used as stand-ins for software businesses, but none represents only B2B SaaS companies.
These figures describe the median website in each category, including its branded search clicks. They do not give SaaS-specific conversion rates, lead quality, pipeline, or nonbranded commercial traffic.
Sitewide click-through rates differ by industry
Ahrefs’ separate click-through-rate report provides another descriptive breakdown: median sitewide click-through rates across industry categories in June 2026. The categories below are broad. For example, Internet & Telecom includes businesses other than SaaS software providers.
These are clicks divided by search impressions across an entire website, not the click-through rate for a page in first place. The industry counts published by Ahrefs should not be taken as proof that the corresponding CTR and click totals come from an identical matched panel. Brand searches and the mix of ranking positions can change the sitewide figure considerably.
Use the correct denominator for each benchmark
Ahrefs’ Domain Rating and industry traffic comparisons come from an aggregate sample of 344,956 websites, but its indexed-page analysis covers 277,650 websites. Its click-through-rate study draws from yet another set of sites. Treating all those figures as though they describe exactly the same websites would create a comparison Ahrefs did not make.
The traffic figures are monthly Google Search Console clicks, rather than analytics sessions or the estimated traffic reported by third-party SEO tools. For a comparable internal benchmark, use the same metric and monthly window. Keep branded versus nonbranded queries and commercial versus informational pages separate before interpreting any shortfall.
What counts as a good organic click-through rate?
Ahrefs’ 2026 sitewide CTR study suggests that roughly 1–2% can be a useful broad reference point for a whole website. But its industry and authority tables show why that range varies. This metric is calculated as total Google Search Console clicks divided by total search impressions for a website across all of its queries.
Do not confuse it with the CTR for a single result ranking first. Position-specific CTR studies and sitewide CTR are different measures. Brand searches, local results, SERP features, query intent, device mix and the distribution of ranking positions all affect the calculation.
If a SaaS site has an unusually high share of branded searches, its CTR may look stronger than a competitor that ranks for thousands of broad category questions. That tells you something about demand and exposure, not automatically about the quality of its content.
What AI Overviews change about these benchmarks
Organic positions no longer fully describe the search experience. Ahrefs’ February 2026 study compared 300,000 keywords and estimated a 58% lower average click-through rate for the first organic result when an AI Overview appeared. The finding does not imply that every SaaS page loses 58% of clicks, but it does undermine simplistic forecasts based only on rank.
For this reason, a B2B SaaS performance dashboard should distinguish branded from nonbranded traffic, commercial from informational intent, conversions from visits, and query groups with visible AI Overviews from those without them. Read my companion AI search and GEO statistics report for the source-level evidence.
How to build a defensible SaaS SEO benchmark
Define a comparable cohort. Choose competitors with a similar business model, product category, customer size and geography.
Separate brand and nonbrand. Don’t use high-volume brand searches to judge whether your content strategy attracts new buyers.
Choose meaningful page groups. Compare alternative and comparison pages with similar commercial pages, not with help-center articles.
Use medians and distributions. Mean traffic is easily skewed by a small number of dominant websites.
Track clicks alongside pipeline. A high-value enterprise software lead and a casual tutorial visitor are different outcomes.
Record the measurement period. Check seasonality and compare like-for-like months rather than assuming growth or decline from one snapshot.
For SEO content planning, the point of benchmarking is to improve the next decision, not decorate a performance deck. If the site is small and young, prioritize a narrow set of decision-stage topics with clear buyer needs. If an established content library already exists, investigate pages with impressions but falling clicks, unresolved content gaps and opportunities for better internal linking.
Methodology and limitations
This page summarizes Ahrefs’ live, periodically refreshed benchmark articles, which currently display June 2026 Google Search Console measurements, plus a separate February 2026 AI Overview click-through study. Ahrefs reports 344,956 websites for its overall traffic comparison and 422,421 websites for its click-through-rate study. However, the Domain Rating group counts printed in the CTR article sum to 344,956 rather than 422,421; the indexed-page subgroup counts sum to 277,650. Because the source does not resolve that discrepancy or establish an identical website panel for every comparison, these figures should not be treated as precise matched-site estimates. They are cross-industry medians, not SaaS-specific targets, and show association rather than causation. Capture the data month separately from the webpage’s original author date when citing this living report.
Last updated: October 11, 2026. This reference brings together primary research published in 2026 on AI-assisted B2B buying, Google AI Overviews, organic clicks, AI referral traffic, brand mentions, citations, and common GEO tactics. It is aimed at B2B SaaS content teams trying to decide what to measure and what to improve.
The studies do not all measure the same population. Forrester and Gartner surveyed business buyers; Pew surveyed U.S. adults; Semrush, Ahrefs and Similarweb examined search results, traffic and AI answers. I have kept those distinctions explicit rather than labelling every number a “B2B SaaS benchmark.”
97% of valid llms.txt files received zero requests during May 2026 (Ahrefs, Jun 2026).
2026 AI search statistics: master reference table
Publication year refers to the research release, while the scope column records when the underlying behavior or traffic was measured. Some reports published in 2026 analyze 2025 data.
Buyer surveys offer the closest evidence for B2B SaaS, although neither study is restricted to software purchases. The useful question is where AI enters evaluation, and which steps buyers still want to validate elsewhere.
Forrester’s State of Business Buying 2026 reported that 94% of business buyers used AI during the buying process. The study drew on nearly 18,000 buyers surveyed in 2025. Forrester also found that buyers turn to peers, experts and analysts to check AI output. This is evidence of reported usage, not a measure of purchases caused by AI.
Gartner’s May 2026 survey of 645 B2B buyers, conducted in August and September 2025, reported a narrower measure: 45% used generative AI in a recent purchase, chiefly to research vendors and products. Respondents used an average of seven information sources, and 69% preferred to validate AI-generated insights with a sales representative. In the same study, 70% preferred a completely digital, self-service buying experience.
These figures are not contradictory. “AI at any point in the buying process” and “generative AI in a recent purchase” are different questions from different samples. For a SaaS team, they support auditing the product information buyers can independently verify: positioning, use cases, integrations, limitations, security details, pricing explanations, demonstrations and customer evidence.
Google AI summaries are familiar to many searchers
Consumer research helps explain the broader discovery environment, but it is not a direct measure of B2B purchasing. Pew Research Center surveyed 5,119 U.S. adults from February 17 to 23, 2026 and found that 60% said they ever read AI summaries at the top of search results. The share was 72% among adults ages 18–29 and 38% among those ages 65 and older.
“Ever read” describes reported exposure, not how often someone reads summaries, whether they trust the answers, or whether they click a cited result. Those are separate behaviors and need separate measures.
AI Overviews are appearing more often on commercial searches
Commercial searches matter because they include the comparison and evaluation work common to software buying. Semrush analyzed more than 600,000 U.S. desktop keywords across 10 industries between November 2025 and April 2026. In that sample, the share of commercial-intent results showing an AI Overview grew 71%, while the equivalent measure for transactional searches fell 5%.
The study covers several industries, not a B2B SaaS keyword set. It shows where AI Overviews are expanding in the sampled search results; it cannot tell us that 71% more SaaS comparison searches displayed AI Overviews. Teams should check their own high-intent query groups rather than assume the aggregate applies uniformly.
How commercial search growth differed by industry
Semrush’s commercial-intent dataset spans 10 industries. Its 71% average growth measure masks considerable variation across the categories surveyed. The examples below are changes in AI Overview appearances for commercial-intent queries between November 2025 and April 2026, not shares of all searches and not SaaS-specific estimates.
Industry in Semrush’s sample
Change in commercial-intent AI Overview appearances
In the same research, transactional-intent AI Overview appearances fell 5% on average. Semrush also found a difference in average cost per click for some categories: finance keywords with AI Overviews averaged $4.84, compared with $2.14 for finance keywords without them. These comparisons describe the sampled keywords, not paid-media costs for an individual SaaS business.
AI Overviews can change organic click-through rates
Ahrefs’ February 2026 CTR update used 300,000 keywords: 150,000 with AI Overviews and 150,000 informational keywords without them. Comparing aggregated Google Search Console click-through rates from December 2023 and December 2025, it estimated that the presence of an AI Overview corresponded to a 58% lower average click-through rate for the top-ranking page.
This is a modeled comparison, not a guarantee that an individual page will lose 58% of its clicks. But it makes a useful distinction for reporting. Ranking position, search impressions, organic visits and appearance inside an AI-generated answer are no longer interchangeable indicators of visibility.
For pages that once relied on a top organic position, compare impressions and clicks over time, segment queries with AI Overviews, and review changes in demand and intent. A lower click-through rate might have several causes; the presence of an AI Overview is one testable factor.
Click-through differences by ranking position
Ahrefs measured position-specific click-through-rate differences for two sets of 150,000 keywords, comparing December 2023 and December 2025. The estimated reductions were not identical for every ranking position.
Organic position
Estimated CTR difference associated with AI Overviews
The percentages are study-level estimates, not observed before-and-after losses for a specific SaaS URL. The comparison is based on desktop click-through data and cannot isolate every change to search behavior across the two years.
AI referral traffic is growing from a small base
The phrase “AI traffic is exploding” is easy to misread without a denominator. Semrush’s April 2026 traffic channel study analyzed billions of visits across more than 50,000 sites in 17 industries during 2025. AI referrals grew 66%, but accounted for less than 0.15% of total visits in that dataset.
Similarweb’s 2026 AI referral analysis estimated 770.7 million average monthly AI referral visits worldwide between June 2025 and May 2026, up 117.4% year over year. This covers desktop and mobile web and measures a different universe and time period from Semrush’s study.
Both can be true. One report emphasizes the channel share across a sample of sites; the other estimates global volume and growth. They should not be combined into a single funnel, or used to project a particular SaaS company’s traffic without site-level evidence.
AI referrals vary by industry and interface
Semrush’s traffic-channel study includes a useful constraint on the overall 66% growth figure. Its computer software and development category recorded a 26% decline in AI referral traffic during 2025, while retail grew 343% and apparel 319%. These are sector-level changes in Semrush’s dataset. Computer software and development is not a statistically representative sample of B2B SaaS vendors.
The same study reports Google AI Mode growing from 1,600 visits in January 2025 to 38.2 million visits in December 2025 in its tracked data. Semrush counts AI Mode separately from conversational-AI referral traffic. Combining those series would change the channel definition and misstate the comparison.
A citation and a brand mention are different outcomes
Ahrefs examined 863,000 keyword SERPs and four million AI Overview URLs and found that 37.9% of cited URLs also appeared within the first ten search-result blocks for the same query. That count included regular results and SERP features, so it is not equivalent to saying 37.9% ranked among the first ten ordinary organic blue links.
Meanwhile, Semrush’s ghost citations study classified 3,981 domain appearances across 115 prompts in 14 countries and four AI engines. It found that 61.7% were citations without an accompanying brand mention; 13.2% combined a citation with a mention, and 25.1% were mentions without a citation.
For GEO reporting, I would avoid collapsing these outcomes into one “AI visibility” score. Track at least four separate things: whether the brand is named, whether a page is cited, which relevant queries trigger those appearances, and whether users actually visit or convert.
What the citation and mention categories actually count
Semrush and Kevin Indig’s ghost-citations study counted 3,981 domain appearances across 115 prompts, 14 countries and four AI search interfaces. The three outcomes describe distinct classifications for a domain appearance, not conversion rates or user behavior.
A separate Ahrefs analysis distinguished ordinary organic links from all search-result blocks. Among AI Overview-cited URLs, 37.1% appeared among the first ten standard organic results, 26.2% ranked 11 to 100, and 36.7% did not rank in the top 100 ordinary organic results. These numbers come from a different query sample and should not be compared directly with Semrush’s mention categories.
What the data says about GEO tactics
Structured data is useful, but it is not a proven citation shortcut
Ahrefs tracked 1,885 pages that added JSON-LD structured data and compared them with 4,000 control pages across Google AI Overviews, AI Mode and ChatGPT. The matched analysis found no meaningful citation uplift for AI Mode or ChatGPT; the AI Overview estimate was a small decline relative to controls. This does not make structured data useless for ordinary SEO. It means the study did not show that adding schema alone causes more AI citations.
In Ahrefs’ matched schema experiment, pages adding structured data recorded an estimated −4.6% relative citation change in Google AI Overviews, +2.4% in Google AI Mode and +2.2% in ChatGPT. The last two estimates were statistically indistinguishable from zero. Ahrefs cautioned against treating the first estimate as evidence that schema itself harms citation performance.
There is little evidence that llms.txt is a priority
Ahrefs examined 137,000 domains and found that 28% published an llms.txt file. Among the valid files, 97% received no requests in May 2026. The result describes server requests in the sampled data, not every possible AI system, but it is a strong reason to avoid treating llms.txt as a guaranteed GEO lever.
The more useful work is often less novel: make product information clear and crawlable, maintain factual source pages, publish original evidence, update outdated claims, and assess what buyers actually need to validate. See my earlier breakdown of SEO versus GEO for B2B SaaS for the practical workflow.
How I’d use these statistics in a B2B SaaS content program
Separate buying research from traffic research. Buyer surveys help explain discovery and validation; analytics reveal what users did on your website.
Audit your evaluation-stage search queries. Check whether AI Overviews appear for comparisons, alternatives, integration questions, pricing and product use cases.
Measure citations and mentions separately. A source link that never names your brand is a different outcome from an explicit recommendation.
Keep publication and data dates together. A report published this year can describe responses collected last year.
Compare conversions, not just referrals. Growth from a small base can look spectacular while remaining commercially minor.
Invest in evidence you control. Product documentation, transparent methodology, screenshots, case studies and original research create material buyers can independently check.
If you are producing statistical reference pages, I have also documented how I verify statistics before citing them, including my rules for primary sources, measurement periods, and misleading comparisons.
Methodology and limitations
This edition includes findings published in 2026 by the organizations that conducted the underlying surveys, traffic analyses or search experiments. Some data were measured in 2025; those measurement windows are identified rather than relabeled as 2026 responses. The studies use different populations, sampling methods, geographies and outcome definitions. They are presented side by side for reference, not pooled into one statistical estimate. I excluded estimates from secondary roundups and claims I could not verify against the producing organization.
I’ve become a lot more suspicious of statistics that look current simply because the page around them is current. Here’s the process I now use before a number makes it into anything I publish.
Many a time, I have spent an embarrassing amount of time chasing statistics around the internet. You find a number that fits what you’re researching, the article looks recent, and there is a source attached to the claim, so you assume you’re probably one click away from the original research. Then you click.
The “source” is another article.
You open that one, find its citation, and click again. Sometimes there is another article after that. And another. By the time you eventually reach the organization that actually produced the number, a few different things may have happened:
the statistic is several years older than the page you found it on;
the original study measured a much narrower group than the article now suggests;
the wording has shifted from something like “tried” to “regularly uses”;
the original methodology adds context that changes how impressive the number looks; or
you get to the supposed source and the statistic is simply not there.
That has changed how I research statistics posts a lot, because finding the number is no longer the research to me. It is really just the lead. The research starts when I try to prove where the number came from, what it actually measures, whether the source is current enough for what I’m writing, and whether I can defend the way I’m using it.
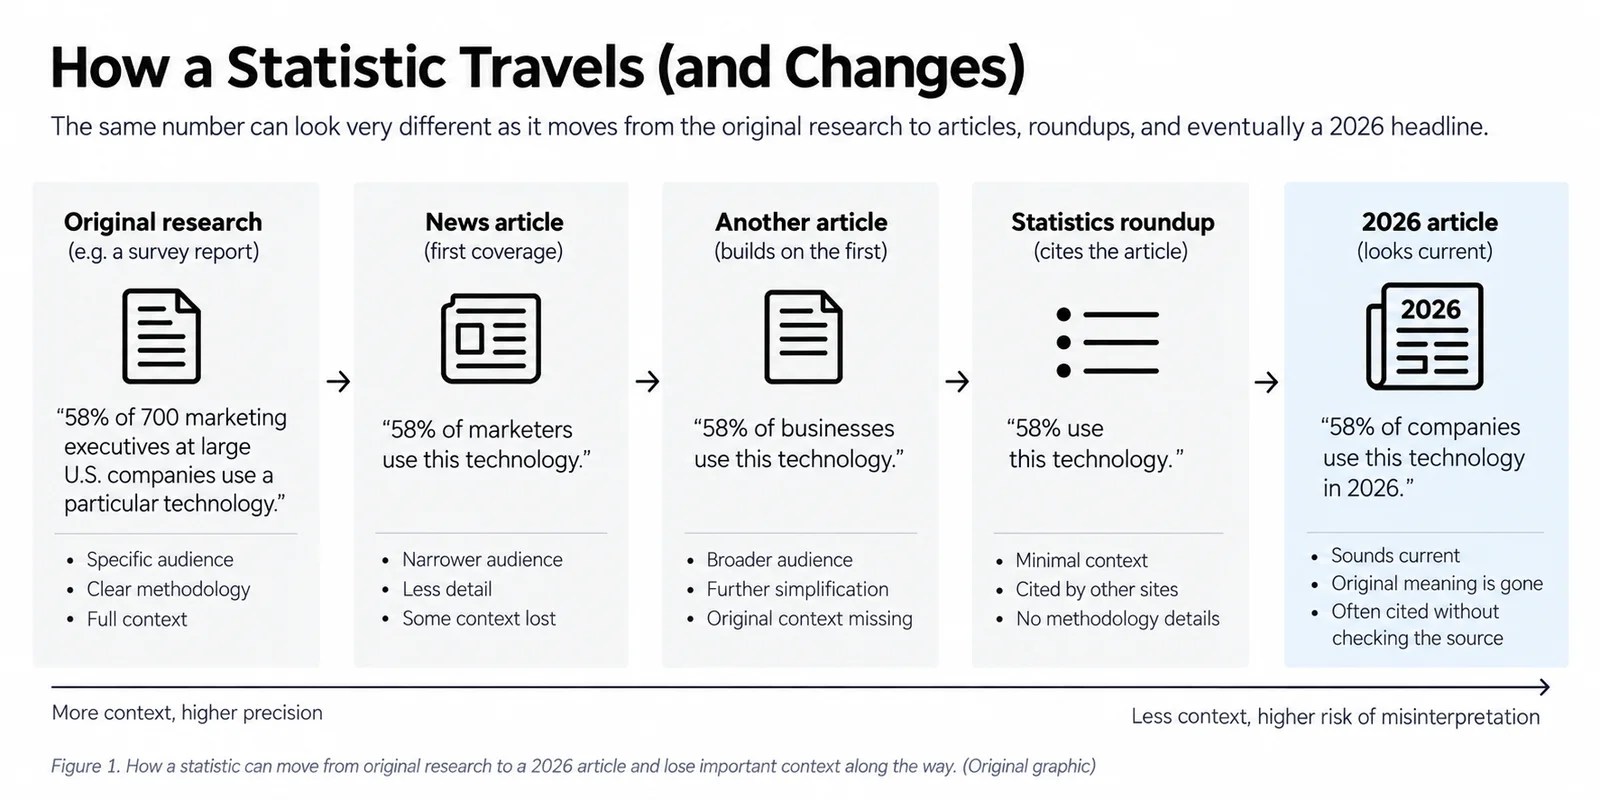
Original graphic. How context can drift as a statistic moves from the original research through secondary coverage.
A number can stay the same while its meaning changes
A lot of statistics online are probably not completely made up. What I run into more often is context getting shaved off as a number moves from one page to another.
Imagine an original survey finds that 58% of 700 marketing executives at large U.S. companies use a particular technology. Another article summarizes that as “58% of marketers.” Someone else cites that article and turns it into “58% of businesses.” A statistics roundup picks up the claim, another roundup cites that roundup, and eventually you find the same number sitting inside a page with “2026” in the title.
The percentage has survived perfectly. The meaning hasn’t.
That is also why I’m careful with phrases that sound close enough to be interchangeable. Depending on the study, any of these could describe different things:
people who have tried an AI tool;
people who use one at least occasionally;
people who use one every day;
people who use AI specifically for search;
people who say AI has replaced some of their traditional search behavior.
If the original research measured the first one, I don’t want my article quietly turning it into the fifth one because that makes for a better headline.
I check the publication date and the data date separately
This is probably the easiest way for a genuinely current report to get described imprecisely. A report can be published in 2026 and still be based on fieldwork from late 2025. There is nothing wrong with that. Research takes time to analyze and publish. I just want to be precise about which date refers to what.
A good example is McKinsey’s Global Tech Agenda 2026. McKinsey published it on February 9, 2026, but the methodology says the online survey was in the field from September 29 to November 10, 2025. The survey had 632 respondents across 69 countries and 24 industries and subindustries.
I can still use research like that in a 2026 statistics post if my rule is “published in 2026.” What I should not do is say 632 people reported something “in 2026” when those people actually answered the survey in late 2025.
It sounds like a tiny distinction until you start comparing studies, tracking changes over time, or building an annual reference page where recency is part of the promise.
For the statistics pages I’m building now, my rule is stricter
We’re already heading toward 2027, so I don’t particularly want to publish a “2026 statistics” page that is mostly 2024 and 2025 data wearing a fresh title. For the current batch of statistics posts I’m working on, the substantive numbers need to come from primary research published in 2026.
If a 2026 report used 2025 fieldwork, I’ll preserve that detail. That gives me a clean publication-year standard without pretending the measurement itself happened later than it did.
What I actually mean by a primary source
My rule here is fairly simple: I want to get as close as possible to whoever actually generated the data.
So if Pew Research Center ran the survey, I want the Pew report. If a company analyzed data from its own platform, I want that original analysis. If an academic team conducted the study, I want the paper. If a government agency collected the dataset, I want the agency’s release or database rather than an article summarizing what the agency supposedly found.
Secondary sources are still useful for discovery. Sometimes a great article is how I learn that a study exists in the first place. I just don’t want my trail to end there.
My quick primary-source test
Did this organization produce the evidence behind the number, or are they telling me what somebody else found?
If they produced it, I start checking the methodology. If they are quoting somebody else, I follow the citation and keep going.
Company research can still be primary research
I also don’t think “primary source” automatically means government or academia. A company analyzing a large dataset it actually owns can be the primary source for that analysis. The same goes for a research firm conducting its own survey or a software platform publishing aggregate data from its product.
I still want to know how the study was designed and what incentives sit around it, obviously. A vendor having a stake in the topic matters. But useful first-party data does not suddenly become secondary just because a company produced it.
My verification process before a statistic makes the cut
Once I find a promising number, I basically start interrogating it. I don’t need every article to turn into an academic literature review, but there are a few things I want to know before I’m comfortable putting the statistic on a page someone else might cite.
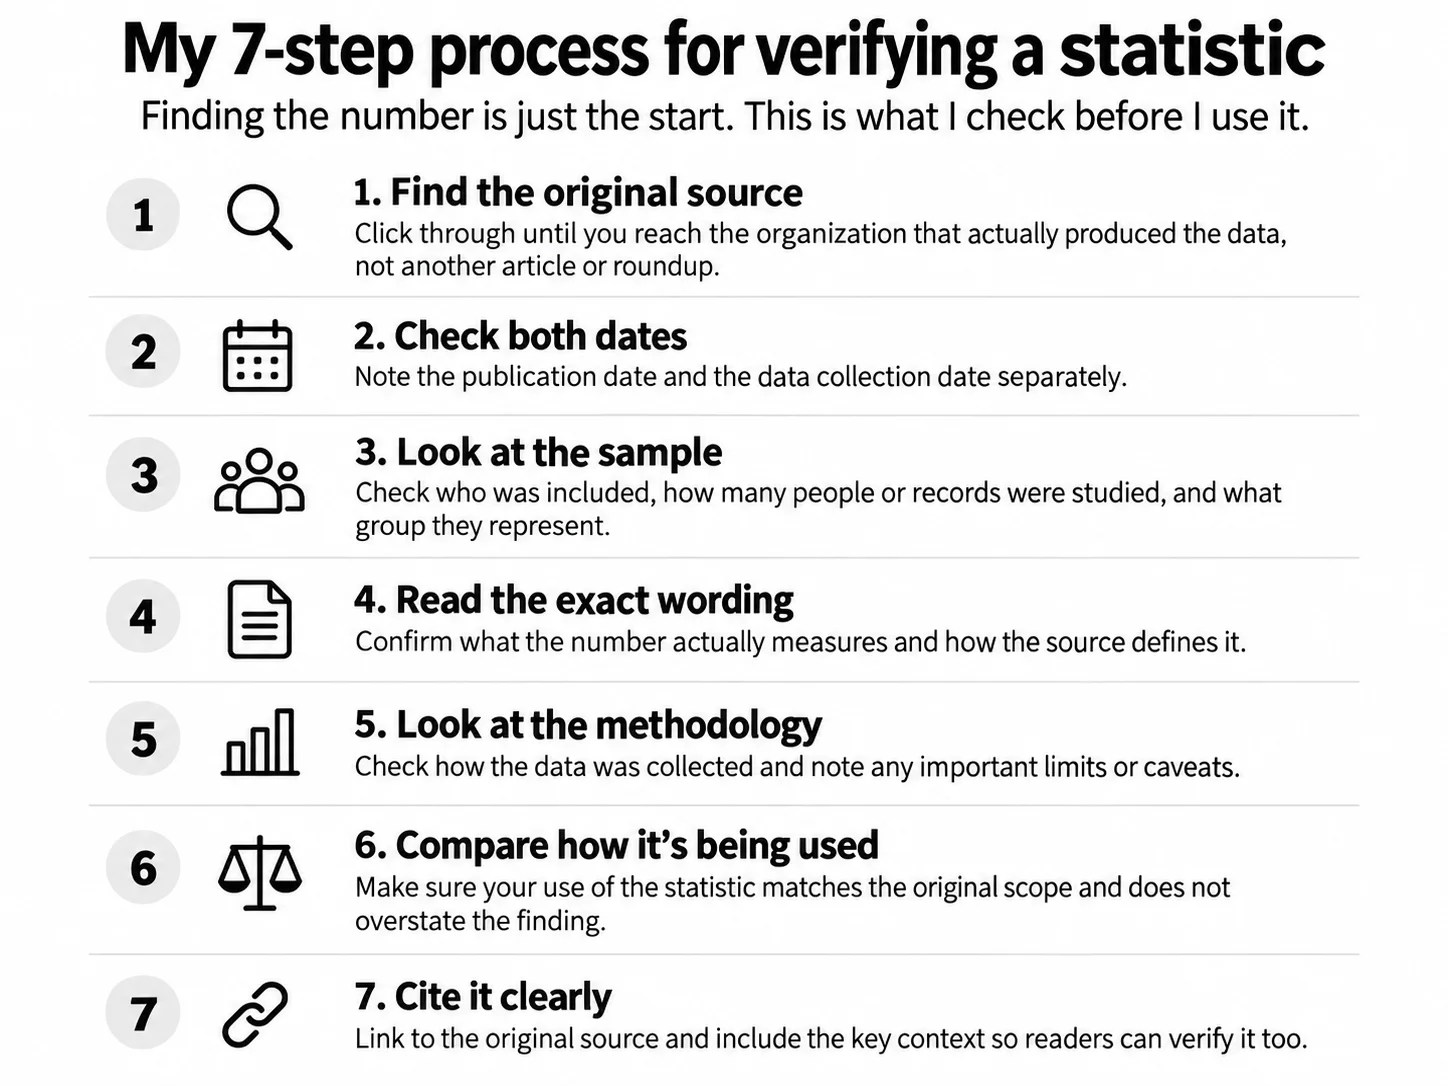
Who actually produced the number? I keep following citations until I reach the original report, dataset, study, survey, filing, research page, or official release.
When was it published? For the current statistics library, that means 2026.
When was the data collected? I look for fieldwork dates, measurement windows, crawl dates, query dates, or whatever period makes sense for the research.
Who or what was measured? Consumers, B2B buyers, marketers, executives, websites, queries, sessions, domains, and citations are all different populations.
How large was the dataset? Sample size does not decide quality by itself, but it tells me a lot about what kind of claim the study can support.
What exactly does the percentage measure? This is usually where superficially similar statistics stop being comparable.
What does the methodology say that the headline doesn’t? Weighting, geography, exclusions, definitions and study design can change how I interpret the result.
Original graphic. My seven-step check before I cite a statistic.
Scope is where I think a lot of stats posts go wrong
A huge dataset can be incredibly useful and still be the wrong evidence for the claim you want to make. An analysis of millions of consumer searches can tell us a lot about search behavior generally, for example, while telling us very little specifically about how B2B SaaS buyers research software.
This is something I’m watching closely in the AI search and generative engine optimization research I’m working on now. There are plenty of interesting numbers about ChatGPT, Google AI Overviews, Perplexity, AI referral traffic and AI citations. That does not automatically make all of them “B2B SaaS statistics.”
If the source studied the broader web, I’d rather say that clearly and then explain why the finding might matter to B2B SaaS than quietly change the population because the narrower framing fits my article better.
And similar-sounding metrics can still be completely different
This becomes especially messy with AI search because there are several layers that people sometimes collapse into one conversation:
adoption: whether people or organizations use the technology at all;
usage frequency: how often they use it;
visibility: whether a brand or domain appears in an AI-generated result;
citations: whether the system explicitly cites a source;
referral traffic: whether somebody actually clicks through to the site; and
conversion: what those visitors do after they arrive.
You can have strong growth in one layer and barely any movement in another. That is why I don’t want to put two percentages beside each other simply because both contain the words “AI search.”
Sometimes the correct result of the research is deleting the number
This is probably the biggest change in how I approach statistics content. I used to think a better statistics page meant collecting more statistics. Now I care much more about how many of those numbers I can actually defend.
I’ll usually drop a statistic when:
I cannot locate the original research;
the supposed source exists, but the statistic is not actually there;
the underlying data is too old for the page I’m building;
I cannot work out who or what the number describes;
a key definition has disappeared somewhere along the citation chain;
the methodology makes the number unsuitable for the claim I wanted to make; or
dozens of sites repeat the statistic, but every citation eventually loops back to another secondary page.
That last one is especially funny because repetition can make a statistic feel extremely established. You search for it and see the same number everywhere, so surely somebody must have checked it. Then you start opening the citations and realize half the internet is effectively citing the other half.
I’d rather publish 27 statistics I can trace cleanly than force a page to “100+ statistics” because the bigger number looks better in a title.
The analysis gets better once I know what I’m actually comparing
This is the part I care about beyond just having clean citations. Verifying the source, scope and methodology lets me compare the evidence without accidentally comparing different things.
Say one 2026 dataset shows AI referral traffic growing by several hundred percent, while another shows AI referrals still account for a tiny share of total website traffic. I don’t immediately see a contradiction there. Something can grow very quickly from a tiny base and still remain small in absolute terms.
The same thing applies to adoption and usage. One study could show a lot of people have experimented with AI search while another shows much lower daily usage. Again, both can be true. Trying something and building it into your normal behavior are different measurements.
I prefer to analyze clusters of evidence
For the actual statistics pages, I want the numbers to stay easy to find. Somebody who landed on the page because they searched for one statistic should not have to dig through a mini essay after every bullet.
So the structure I’m moving toward is fairly simple:
put the strongest statistics near the top;
give readers a master table they can scan quickly;
group related statistics into useful sections;
then step back after each cluster and look at what the group of findings actually suggests.
That is where I can start asking the questions I actually find interesting: Do independent datasets point in the same direction? Are two studies disagreeing because they measured different populations? Is the giant growth percentage mostly a base-effect story? Does visibility turn into citations? Do citations turn into clicks? Do clicks turn into anything useful?
And if the evidence cannot answer one of those questions yet, saying that is useful too.
There is still a line between inference and making up a story
If 22% of respondents did something, I can say roughly one in five did it. I can say about 78% did not. If another genuinely comparable group is at 44%, I can quantify the difference between them.
What I cannot do is decide the other 78% “don’t trust the technology” unless the study actually asked them why. There could be a dozen explanations, and the percentage by itself does not tell me which one is true.
The same goes for causality. Two things moving together can be worth pointing out, but I don’t want to quietly turn correlation into a causal story because it makes the analysis sound smarter.
So yes, fewer statistics.
I still want these pages to be very easy to use. If someone Googles a statistic, lands on one of my pages, and only needs the number and the source, they should be able to get both quickly. The table should work. The attribution should be obvious. The original research should be one click away.
Underneath that simple surface, though, I want the research process to be annoyingly rigorous. I want to know where the number came from, when the evidence was collected, who was measured, what the metric actually means, and what the methodology allows me to say about it.
Sometimes that process gives me a better statistic. Sometimes it gives me a more interesting comparison. And sometimes, after opening eight tabs and spending 20 minutes trying to verify one sentence, it tells me to delete the damn number.
An SEO content brief should make the important decisions before a writer opens a blank document. It is where a team decides who the page is for, what question it needs to answer, what the product has to contribute, which claims need evidence, and what the reader should understand by the end.
A list of keywords and competitor links is not enough. It can point a writer toward a topic, but it does not explain the commercial purpose of the page or stop the result from becoming a generic summary of other search results.
For B2B SaaS, the strongest briefs connect search demand with product knowledge and a real decision. They give a writer enough direction to be accurate without turning the job into a paint-by-numbers outline.
Start with the page’s job
Every brief needs one clear answer to this question: what should this page do for the reader and the business?
That answer changes the brief. A comparison page may help a buyer choose between options. A product-led article may show how a workflow works. A category explainer may help an early-stage reader understand a problem before they know the language for it.
Write the job in one or two sentences. Avoid a vague instruction such as “rank for content strategy.” Say what the person is trying to decide or do.
Brief input
Weak version
Useful version
Reader
Marketers
A SaaS content lead deciding whether a freelance specialist or an agency is a better fit for a defined quarterly program.
Search intent
Informational
Comparison and hiring intent. The reader wants trade-offs, likely scope, and questions to ask before choosing.
Business purpose
Get traffic
Support people already considering outside content help and guide qualified readers to the relevant service page.
Reader outcome
Learn about the topic
Leave with a practical choice framework and a clear sense of which option fits their operating model.
Include the buyer, decision stage, and context
Search terms do not reveal everything a writer needs to know. Two people can search the same phrase for different reasons. One may be gathering background. Another may be preparing a budget, comparing providers, or looking for language to use in an internal discussion.
Give the writer the context you already have:
the role most likely to read the page
their company type, team size, or operating situation where relevant
what they probably know already
the decision they are approaching
the objections or constraints likely to shape that decision
This is also where product context belongs. If the article needs to mention a product, explain what it actually does, who uses it, where it fits in a workflow, and where it does not fit. A writer should not have to infer that from a homepage.
Define the angle before choosing headings
The angle is the reason this page deserves to exist separately from the other results. It prevents a brief from becoming a recycled definition article.
Page angle
What it would cover
What it should avoid
Practical template
The fields a writer needs before drafting, with examples and a reusable structure.
Pretending one template works unchanged for every content type.
Hiring guide
What to expect from a freelance brief writer or strategist.
Turning the page into an unsupported pricing roundup.
Product-led workflow
How a team can turn sales calls, documentation, and product knowledge into better briefs.
Mentioning the product only in the final paragraph.
SEO and GEO update
How evidence, entity clarity, and source requirements affect a modern brief.
Claiming there is a secret format for AI citations.
The angle should be narrow enough that the page has a point of view, but not so narrow that it cannot answer the main search question.
Give the writer the right evidence
Useful B2B SaaS content needs more than search-result observation. A brief should identify what evidence is available and what needs to be checked before a claim appears in the draft.
product documentation and help-centre pages
public pricing or packaging pages
screenshots or a guided product walkthrough
customer stories with permission to use them
sales-call questions, support themes, or onboarding friction
first-party research, original reports, or primary external sources
a subject-matter expert who can answer unanswered questions
Label the strength of the evidence. A published help article can support a product behavior claim. A sales-call note may indicate a question worth investigating, but it should not become a customer quote or a universal claim.
Google’s guidance for helpful content and AI search experiences leads to the same practical requirement: the page needs useful, accurate material that gives a reader a reason to trust it. A brief is where that expectation becomes concrete.
Map the search landscape without copying it
Search results are useful for understanding the language, subquestions, formats, and competing page types around a topic. They are not a permission slip to reproduce the same article with different sentences.
Research note
Why it belongs in the brief
Query and close variants
Shows the wording and adjacent questions readers use.
Dominant page types
Helps distinguish a guide, a comparison, a template, a product page, or a provider list.
Useful unanswered questions
Identifies gaps worth addressing with actual evidence.
Claims to verify independently
Stops unsupported competitor claims from entering the draft.
Existing site pages
Prevents overlap and identifies internal links that make sense.
Do not ask a writer to beat ten competitor articles by adding every heading they use. Ask them to make the page more useful for a specific reader.
Build an outline around decisions, not filler
Headings should earn their place. Before adding one, ask what the reader will be able to understand, compare, or do after that section.
For a standard B2B SaaS post, a strong outline usually includes a direct opening, the core explanation or decision framework, product or operational context where it matters, evidence, constraints, a useful next step, and only the FAQs that remain genuinely unanswered.
The exact structure should change with the content type. A research article needs methodology and limitations. A comparison needs selection criteria and transparent disclosure. A case study needs verified context, implementation, and evidence. The brief should say which format is being used and why.
Add internal links as part of the argument
Internal links should help a reader move to the next useful page. They should not be a last-minute block of exact-match anchors.
Destination
Why the reader might need it
Natural point in the article
Content brief services
A reader who needs this work done rather than a template.
After the template or scope discussion.
SEO content writing services
A reader moving from planning into production.
After explaining the relationship between a brief and a finished piece.
Content strategy services
A reader whose issue is not the brief itself, but scattered priorities.
When discussing inputs, priorities, and measurement.
If the destination page does not exist or does not support the claim, leave the link out of the draft until it does.
The working SEO content brief template
Page title and working URL: A clear, durable title and the proposed slug.
Reader and decision: Who the page is for, what they are trying to decide, and what they should understand by the end.
Business purpose: The commercial role of the page, without forcing a sales pitch into the body.
Primary angle: The specific reason this page exists instead of duplicating a neighboring page.
Search context: Main query, related questions, page types visible in search, and useful gaps to address.
Product and company context: Relevant workflow, terminology, features, limitations, target customer, and approved claims.
Outline: A section-by-section path through the reader’s question, including what each section needs to accomplish.
Internal links and CTA: Pages that materially help the reader, plus the next step for a qualified buyer.
Editorial notes: Voice, terms to use or avoid, technical accuracy checks, and things the article must not claim.
Copy-and-fill brief for a SaaS comparison page
Use this as a starting document for a commercial article. The details below are illustrative; replace them with actual product evidence, buyer research and approved claims before assigning the brief.
Page and search intent. Working title: [Product A vs Product B: which fits your team?]. Primary query: [verified target query]. Search goal: help an evaluating buyer compare two actual options.
Reader and decision. Role: [buyer or evaluator]. Existing setup: [current software and workflow]. Decision: [what they need to choose]. Constraints: [budget, integrations, security, migration, team size].
Business role. Page type: evaluation-stage comparison. Desired reader outcome: understand which product fits which requirements. Relevant next step: [demo, trial or comparison resource], only if it genuinely helps.
Angle and differentiation. What competing pages omit: [specific unanswered buyer question]. Unique information we can provide: [first-hand testing, implementation notes, expert interview or documented customer experience]. Do not claim a difference without evidence.
Product evidence packet. Source each product’s current features and limitations using official documentation, release notes and pricing pages. Record the date checked, plan tier, geography and any caveats. Add testing screenshots and notes where available.
Evaluation criteria. Select criteria relevant to this buyer, such as core workflow fit, implementation effort, data migration, integrations, permissions, support, reporting, pricing structure and contractual limitations. Explain why each criterion affects the decision.
Proposed article structure. Short verdict for each buyer profile; side-by-side comparison table; evaluation criteria and evidence; practical differences in real workflows; costs and constraints; what to check before buying; conclusion tied to the reader’s requirements.
Required reporting. Record the source and verification date for pricing or feature claims. Separate your own product testing from vendor claims. If access was unavailable, state that clearly instead of implying hands-on evaluation.
Internal links. Add [relevant use-case guide], [related alternatives page] and [approved product page] where they help the reader. Confirm each destination is live and genuinely relevant.
What changes for a research post or a product review?
For a statistical reference page, replace the buyer-verdict structure with your scope, timeframe, original research sources, an at-a-glance list, a master statistics table, segmented findings and a methodology note. Record the measurement year separately from publication year. My source-verification process explains how I check those distinctions.
For a product review, add hands-on test tasks, product access level, test date, screenshots, limitations and the difference between observed behavior and marketing claims. A review built only from vendor copy should say so explicitly.
A final quality check before drafting starts
Is the reader and decision specific enough to guide the piece?
Is there a reason this page exists separately from related site content?
Does the writer have enough source and product material to avoid generic claims?
Is the outline solving the reader’s problem, rather than merely reflecting competitor headings?
Are the internal links and CTA useful at the point they appear?
Are the claims, pricing, examples, and proof items either verified or clearly marked for verification?
A content brief will not make weak source material strong. It does make weak inputs visible early, when the team can still fix them. That is usually cheaper than repairing an article after it has already gone through drafting, review, and design.
Should every SEO content brief include keywords?
Usually, yes. They should be part of the search-context section, not the whole brief. The writer also needs the reader, decision, evidence, product context, and page angle.
How long should an SEO content brief be?
Long enough to remove important ambiguity. A simple update may need a page. A comparison, product-led article, or research piece may need a more detailed source and evidence plan.
Can an AI tool create the brief?
An AI tool can help organise research or surface questions. It cannot verify product claims, interview an expert, decide the page’s commercial role, or create proof that does not exist.
For help building source-led briefs for SEO, comparison, product-led, and research content, see content strategy services.
Last updated: October 11, 2026
Most B2B content marketing statistics are easy to repeat and hard to use well. A percentage without the question, survey period, and respondent base is usually weaker than it looks.
This is a small, source-led reference page built from Content Marketing Institute and MarketingProfs’ current B2B research. It focuses on the 2026 report, published in October 2025, rather than carrying forward 2025 planning figures as though they describe the market now.
B2B content marketing statistics at a glance
59% marketing rated at least somewhat effective (B2B marketers; self-rated effectiveness, previous 12 months; CMI and MarketingProfs, report published 2025).
61% content strategy reported improved (B2B respondents with a content strategy; CMI and MarketingProfs, report published 2025).
74% strategy refinement cited as improvement driver (Only respondents reporting strategy improvement; CMI and MarketingProfs, report published 2025).
45% ai-powered marketing tools among top three investment areas (B2B marketers; planned investments for 2026; CMI and MarketingProfs, report published 2025).
40% creating content that prompts action cited as a challenge (B2B marketers; top-three challenges; CMI and MarketingProfs, report published 2025).
39% resource constraints cited as a challenge (B2B marketers; top-three challenges; CMI and MarketingProfs, report published 2025).
33% measuring content effectiveness cited as a challenge (B2B marketers; top-three challenges; CMI and MarketingProfs, report published 2025).
32% owned media among top three investment areas (B2B marketers; planned investments for 2026; CMI and MarketingProfs, report published 2025).
These findings come from the same survey, fielded June 24 to August 14, 2025 and published as a 2026 report. Planned investment and self-reported effectiveness are not measured business outcomes. Percentages refer to the respondent groups specified below.
That sample is broad enough to be useful as a directional benchmark. It does not represent every B2B company, every geography, or every SaaS team. The cleanest way to use these figures is as a prompt for a better internal question, not as a substitute for one.
59% rated their marketing at least somewhat effective
In the 2026 study, 12% of respondents said their marketing was highly effective and 47% said it was somewhat effective. The remaining responses were 31% neutral, 7% somewhat ineffective, and 3% highly ineffective.
Self-rated marketing effectiveness
Share of respondents
Highly effective
12%
Somewhat effective
47%
Neutral
31%
Somewhat ineffective
7%
Highly ineffective
3%
The point is not that 59% is a comforting number. It is that a large part of the group still reported mixed or weak results. A content program can publish regularly and still struggle to show why a buyer should care, which pages influence a deal, or where sales can use the work.
61% said their content strategy improved
Among marketers with a content strategy, 13% said it significantly improved and 48% said it somewhat improved. Thirty percent said it remained stable, while 9% reported some level of decline.
The reported drivers are more useful than the headline. Of marketers whose strategy improved, 74% cited strategy refinement, 51% cited new technology implementation, 40% cited team restructuring or resource changes, and 26% cited measurement capabilities.
Reported contributor to strategy improvement
Share of improving-strategy respondents
Strategy refinement
74%
New technology implementation
51%
Team restructuring or resource changes
40%
Measurement capabilities
26%
Budget adjustments
16%
That does not mean a strategy document creates results on its own. It does suggest that clearer choices about audience, priority pages, product evidence, distribution, and measurement matter more than simply adding another tool to the stack.
Conversion, resources, and measurement remain the main obstacles
When asked to select their top three challenges, 40% chose creating content that prompts a desired action, 39% selected resource constraints, and 33% selected measuring content effectiveness. Creating enough quality content came next at 28%.
Top B2B content marketing challenge
Share selecting it
Creating content that prompts a desired action
40%
Resource constraints: time, people, budget
39%
Measuring content effectiveness
33%
Creating enough quality content
28%
Differentiating content from competitors
24%
Aligning content with the buyer journey
23%
These challenges sit together. A team that cannot define the action a page should support will have a hard time measuring it. A team that has no measurement story will struggle to protect time, budget, or access to subject-matter experts. More production rarely fixes that chain on its own.
AI tools lead planned investment for 2026
Forty-five percent of respondents selected AI-powered marketing tools among their top three planned investment areas for 2026. Events and experiential marketing followed at 33%, then owned media at 32%.
Planned 2026 investment area
Share selecting it among top three
AI-powered marketing tools
45%
Events and experiential marketing
33%
Owned media: content assets, website, blog, email
32%
Paid media
25%
Content personalization
24%
Agency or outsourcing
19%
Research and insights
15%
Planned spend is not proof that a channel works. The useful implication for a content team is smaller: AI tools are now a normal part of the investment conversation, while owned content still matters enough to remain near the top of the list. Teams need a clear view of where human product knowledge, source checking, and editorial judgment sit in that workflow.
How to use these statistics responsibly
Keep the report year and fieldwork period together. A 2026 report can be based on research conducted in 2025.
Name the group behind the statistic. Here, it is 1,015 B2B marketers, mostly from North America, not every B2B team.
Separate plans, opinions, and measured outcomes. Planned AI spending is not a return-on-investment result.
Use a benchmark to frame an internal question. For example, if measurement is a common challenge, ask which pages, actions, and sales signals your own program can actually track.
Link to the original report so the reader can inspect the question and methodology.
Methodology and limitations
This page is a compilation of an original survey, not Wisdom Dabit’s own research. It relies on the report’s stated methodology: a 16th annual survey fielded by Content Marketing Institute and MarketingProfs, sponsored by Storyblok, from June 24 through August 14, 2025. The report received 1,229 global responses and presents the B2B subset of 1,015 marketers.
The study is useful for understanding the surveyed group’s priorities and self-reported experience. It cannot establish that any tactic caused revenue, predict the performance of a particular SaaS company, or explain every market outside its respondent base.
Most SaaS teams get this decision wrong by starting with the supplier.
They compare agency retainers, freelance rates, headcount, and turnaround times before they have worked out what they actually need help with.
If your content lead already owns strategy, your designer is in-house, and your main problem is finding someone who can understand the product and write strong pages, hiring a full agency can be excessive.
If nobody owns the program, five different formats need to ship every month, and you need writers, editors, designers, and SEO support moving at the same time, one freelancer will probably become the bottleneck.
That is the real split.
A strong freelance writer gives you direct access to the person researching, thinking through, and writing the work. A content agency gives you a larger delivery system around the work.
Freelancer vs agency: the main difference is how much delivery infrastructure you need around the writing.
Content agency vs freelance writer: the short version
Hire a freelance writer when you already have someone internally who can own priorities, approvals, and the wider content program. The freelancer can then go deep on research, product context, search intent, and the writing itself.
Hire a content agency when you need several people and capabilities at once. That may include strategy, project management, writers, editors, designers, SEO specialists, and reporting.
Decision factor
Freelance writer
Content agency
Best fit
Focused content programs that need senior execution
Broader programs with several moving parts
Who you work with
Usually the person doing the research and writing
Often an account manager, strategist, or project manager
Product context
Can become very deep over an ongoing engagement
Depends on discovery, writer continuity, and handoffs
Capacity
Limited by one person’s time
Easier to spread work across several contributors
Consistency
The same person can carry context from piece to piece
Depends on editorial systems and who stays on the account
Project management
Usually shared with your internal team
Often included in the engagement
Cost
Usually lower because fewer layers are involved
Usually higher because you are paying for a wider team and management
Start with what your team is missing
Say you already have a content manager choosing priorities, reviewing drafts, and working with design. Your team knows what it wants to publish. The missing piece is someone who can take a topic, understand the product, do the research, find the angle, and turn it into something worth publishing.
You probably need a writer.
Now take a company with no content lead, no editorial process, no regular designer, and a backlog covering blog posts, landing pages, case studies, and refreshes. Someone also needs to plan the calendar, brief writers, chase reviews, and report on performance.
That company needs more than a writer.
The same logic applies to budget. A $6,000 agency retainer can be poor value when you already employ half the roles inside it. A $1,500 freelancer can become expensive when your team spends hours every week doing the coordination the engagement does not cover.
A quote for “four articles” tells you very little until you know which parts of the content process are included.
When a freelance writer is the better fit
You need someone who can get close to the product
This matters a lot in B2B SaaS.
A useful article about documentation software, ecommerce infrastructure, customer onboarding, payments, analytics, or another technical category usually needs more than a summary of what already ranks.
The writer has to understand things such as:
how the product works
where it fits into the customer’s workflow
what competing products do differently
the language buyers use to describe the problem
the objections that come up before purchase
which product claims can actually be supported
Working directly with the writer makes that easier.
They can speak with your product marketer, interview a subject-matter expert, ask the follow-up question that comes up during research, and carry all of that context straight into the draft.
There is less room for the brief to become a game of telephone.
You care who actually writes the work
An agency can have impressive clients, polished case studies, and a smart strategy team. You still need to know who is going to open the document and write your article.
For product-led and commercially important content, I would look closely at the individual writer.
Read work they personally wrote.
Ask how they research unfamiliar products and categories.
See whether they can explain why a piece took a particular angle.
Find out whether the same person will still be on your account a few months later.
With a freelancer, you usually know exactly who you are evaluating before the project starts.
You already have someone who owns content internally
A freelancer fits cleanly into a team that already has a content lead, founder, product marketer, or senior marketer setting direction.
Your internal team can own priorities, approvals, and access. The writer can own the research and execution.
You can widen that scope if the writer also handles strategy, briefs, content audits, or refreshes.
The work needs depth more than raw output
Some content is hard because of the thinking involved, not because the word count is high.
That includes:
comparison and alternatives pages
bottom-of-funnel SEO content
case studies
original research
product-led articles
category education
technical explainers
thought leadership
These pieces get better when the writer has time to understand what the buyer is choosing, what the product can genuinely claim, and where the article needs to go beyond the existing search results.
When a content agency is the better fit
You need a team
One freelancer has one calendar.
If your program needs writers, editors, designers, SEO specialists, project management, and reporting moving at the same time, an agency can save you from assembling and coordinating all of those people yourself.
That is especially useful for:
large site migrations
big content refresh projects
international expansion
high-volume SEO programs
multi-format campaigns
product launches with several assets shipping together
In that situation, the management layer is part of what you are paying for.
You need to increase capacity quickly
A good agency can put several people on a program without asking you to recruit each one separately.
If ten pages need to move this month, a single senior freelancer may be able to take the most important three. An agency can spread the rest across a larger team.
That extra capacity is valuable when deadlines are real and the work can be divided without losing too much context.
Nobody internally has time to run the program
Freelancers still need someone on the client side who can answer questions, provide access, resolve feedback, and make decisions.
If nobody has the time to do that, an agency with solid project management can take more of the operational load.
You still need an internal owner. The amount of day-to-day coordination can be much lower.
The biggest risk with agencies is distance from the work
You can love the people on the sales call and never work with any of them again.
Your strategist might understand the product. Your account manager might understand the brief. The actual writer can still be several steps removed from both.
That does not make agency work bad. It means the handoff deserves attention.
Before signing, ask:
Who will actually research and write the content?
Can I see work from that person?
Can they join product or subject-matter interviews when needed?
How long do writers usually stay assigned to an account?
What happens when the writer changes?
Writer turnover matters more in SaaS than people sometimes expect.
Every new writer has to learn the product, competitors, terminology, audience, previous feedback, internal politics, and dozens of tiny preferences that never make it into a style guide.
A strong agency has a process for carrying that context forward. You should know what that process looks like.
The biggest risk with freelancers is capacity
A strong freelancer can still only do so much work well.
They can get booked out. They can take time off. They can become the bottleneck if the program grows faster than expected.
This is why the scope has to make sense.
If one person is expected to own strategy, keyword research, six articles a week, design coordination, CMS uploads, LinkedIn distribution, analytics, and a large refresh backlog, the setup is fragile from the start.
Senior freelancers can own a large part of the content process. There is still a point where the work needs more hands.
What are you actually paying for?
Freelancers usually cost less overall because there are fewer layers in the engagement.
Agencies usually cost more because the fee may cover strategy, account management, editing, project management, specialist support, and access to several writers.
Neither price means much without the scope beside it. For sourced context on freelance writing rates, publicly advertised agency packages, and in-house salary benchmarks, see my 2026 B2B content marketing cost comparison. Those studies measure different populations and billing models, so use them to frame questions rather than treat any one number as a universal quote.
When you compare quotes, check who owns:
topic and keyword research
search intent
briefs
product and customer interviews
source research and fact-checking
writing
editing
internal linking
on-page SEO
design coordination
CMS publishing
revisions
content refreshes
reporting
A company that hands over a finished brief and edits internally is buying a very different service from a company that expects the supplier to find the opportunity, interview experts, shape the angle, write the page, and help track what happens after publication.
A freelancer can do strategy too
“Freelancer” says how someone works. It does not tell you the level they work at.
Some freelance writers want a finished brief and a deadline. Others work much closer to an embedded content strategist.
An experienced freelance SEO writer may also handle:
content audits
competitor and SERP analysis
topic research
content briefs
bottom-of-funnel planning
internal linking recommendations
editorial planning
content refresh opportunities
The same goes for agencies. Some offer genuine senior strategy. Others package standard keyword research and a content calendar as strategy.
Ask what the work actually includes.
Some teams use a senior freelancer for the most important pieces and an agency for additional production.
A hybrid setup can work well
You do not have to pick one model for every piece of content.
A SaaS company might use:
an internal content lead for strategy and priorities
a specialist freelancer for high-intent SEO, product-led pieces, or case studies
an agency for larger campaigns or additional production capacity
internal subject-matter experts for product and customer knowledge
That setup works when ownership stays clear.
Someone still needs to make the final call on priorities, product accuracy, positioning, and quality. Otherwise, adding more suppliers only gives your team more drafts to manage.
Questions to ask before hiring a content agency or freelance writer
Who will actually write the work?
Can I see relevant work produced by that person?
How will you learn our product, customers, and competitors?
Who owns the topic, search intent, and final angle?
How do you handle subject-matter interviews and source checks?
What happens between the brief and the finished draft?
What is included in the quoted price?
How much work can you realistically handle at once?
What happens if the person assigned to our account changes?
What kind of project would you tell us you are a poor fit for?
The answers will tell you more than the label on the proposal.
So, should you hire a content agency or a freelance writer?
If you are a B2B SaaS team with an existing marketing or content lead and you mainly need someone senior to research, think through, and write the work, I would start with a specialist freelancer.
You get direct access to the person doing the work. That person can build product knowledge over time, carry feedback from one piece into the next, and work closely with the people inside your company who know the product best.
An agency makes more sense when the gap is wider. If you need several specialist roles, higher production capacity, and someone to coordinate all of it, the extra infrastructure earns its keep.
The decision becomes much easier once you list what your team already owns and what still needs an owner.
I work directly with B2B SaaS teams on search-led articles, comparison pages, case studies, original research, and product-aware content. If you need senior content support without adding another management layer, see my SEO content writing services, explore my content strategy services, or get in touch.
Frequently asked questions about hiring a content agency vs freelance writer
Is a freelance writer cheaper than a content agency?
Usually. A freelancer has fewer layers of overhead, while an agency fee may cover strategy, project management, editing, and other specialist roles. Compare the full scope before comparing prices.
Can a freelance writer handle content strategy?
Yes. Experienced freelance content strategists and SEO writers may handle content audits, topic research, briefs, competitor analysis, editorial planning, internal linking, and content refreshes alongside writing.
When should a SaaS company hire a content agency?
An agency makes sense when the company needs several specialist capabilities, higher production capacity, and project management across a broader content program.
Can one freelancer run an entire content program?
Yes, for a focused program. A senior freelancer may handle strategy, research, writing, optimization, and updates. Larger programs usually need extra support for design, editing, publishing, technical SEO, or reporting.
Is an agency better for SEO content?
No. Strong SEO content depends on search understanding, research, subject knowledge, product context, and execution. A good freelancer or agency can provide those skills.
Should a B2B SaaS company hire an agency or a freelancer?
If the company already has an internal marketing owner and mainly needs senior content execution, a specialist freelancer is often the leaner fit. If the company needs an outsourced team to own several parts of the content operation, an agency is usually better suited.
Last updated: October 11, 2026
SEO and GEO are often discussed as separate services, as though one is for Google and the other is for some entirely different internet. That framing creates more confusion than it solves.
For a B2B SaaS company, SEO still covers the work that makes a page discoverable, understandable, useful, and technically available to search engines. GEO, usually short for generative engine optimization, adds another layer of questions: can an AI-assisted search experience understand the claim? Is there enough original evidence behind it? Does the page answer the full decision question, not only the keyword-shaped version of it?
Google’s own guidance is fairly plain. Its AI search features use information from Google Search’s index, and the same baseline rules still apply: crawlable pages, useful original content, clear structure, and compliance with Search Essentials. That does not give anyone a secret recipe for AI citations. It does make one thing clear: treating GEO as a substitute for SEO is the wrong starting point.
SEO still owns the foundation
The parts of SEO that matter most to a serious B2B SaaS site have not gone away:
understanding what a prospective buyer is trying to solve
choosing pages with distinct intent instead of publishing minor keyword variations
making product and category language clear enough for readers and search engines
building internal links that explain how services, use cases, proof, and comparison content relate
keeping pages crawlable, fast, and technically sound
updating pages when the product, market, or question changes
That work is not glamorous, but it is where most content programs either become useful or become a pile of articles with no commercial logic.
What GEO adds to the content brief
GEO does not require a separate voice or a strange format made of tiny answer blocks. It does require a more demanding brief.
Stronger evidence
Generative search experiences can summarize claims quickly. That makes unsupported claims easier to expose, not easier to hide. Product documentation, screenshots, methodology, direct customer language, public pricing, and original research all become more important.
Better question coverage
Keyword research can reveal demand, but it rarely explains the entire decision. Buyers also want to know what an option costs, who it suits, what it does not solve, how it fits into an existing stack, and what the implementation burden looks like.
Clearer entities and relationships
Readers and retrieval systems both benefit when a page clearly distinguishes the product, category, use case, integrations, alternatives, customer type, and constraints. Vague copy makes that harder.
SEO and GEO: the practical difference
Area
SEO work
GEO-aware addition
Discovery
Match a page to a distinct search need and make it crawlable.
Check whether the page makes its central claim, product context, and source base easy to retrieve and verify.
Research
Review search results, buyer questions, product material, and competitive context.
Give more weight to original evidence, documentation, named entities, and the questions a summary is likely to flatten.
Structure
Use headings and links that help a reader navigate.
Make relationships clear: which product, use case, customer, limitation, or alternative is being discussed.
Measurement
Track rankings, qualified visits, conversions, assisted pipeline, and sales use.
Watch answer-engine visibility where it can be observed, without treating a mention as the only success signal.
The table does not describe two separate production lines. It describes one stronger editorial process. A page with weak product context and no evidence does not become useful because it has an AI-search heading in the brief.
Where teams get GEO wrong
The predictable mistake is trying to write for a machine before writing for the buyer. That usually produces repetitive definitions, awkward headings, unsupported statistics, and pages that sound as though they were assembled from search snippets.
Another mistake is claiming that GEO guarantees visibility in a particular answer engine. Search interfaces change, models change, and no vendor can promise a citation. A useful service should be honest about that uncertainty.
Google’s guidance on generative AI content makes a similar point from another angle: using AI to help with content does not remove the need for accuracy, value, and compliance with spam policies. Publishing large volumes of pages without added value is still a bad strategy, whatever label is attached to it.
A practical workflow for SEO and GEO
Start with commercial and buyer questions, then identify the pages that deserve to exist.
Build briefs around the reader’s workflow, objections, product context, and source requirements.
Bring in the best available evidence: documentation, public data, expert context, customer proof, and transparent limitations.
Make the page easy to navigate. Useful headings, descriptive links, tables where comparison matters, and concise summaries do more than a pile of repeated keywords.
Review the page after publication using normal search performance, lead quality, sales conversations, and content gaps. Do not pretend an answer-engine mention is the only outcome that matters.
What to improve first
Start with pages that are already close to a commercial decision. A comparison page needs accurate alternatives and clear fit criteria. A service page needs scope, proof, pricing context, and a credible next step. A product-led article needs a real workflow, not a final paragraph where the product suddenly appears.
Then look at the source material behind those pages. Product documentation, implementation notes, screenshots, customer language, sales-call objections, and internal experts can give a useful article something a generic search summary cannot reproduce.
Example: improving a SaaS alternatives page for search and AI-assisted research
Consider a hypothetical team publishing a page comparing two customer-onboarding platforms. Its current draft lists features from both homepages, repeats generic claims about ease of use, and ends with a short verdict. There is little a buyer can verify beyond the vendors’ own marketing descriptions.
An SEO and GEO-aware revision can start with the same buyer question and improve the evidence:
Define the evaluation job. Is the reader comparing onboarding checklists, in-app guidance, analytics or implementation cost? Set the actual decision before drafting headings.
Check the claims. Link features and integration statements to dated product documentation. Identify the plan tier and anything the team did not test.
Show the workflow. If product access is available, document a reproducible test, such as setting up an onboarding checklist and triggering it for a sample user. Include relevant screenshots and limitations.
Use an honest comparison table. Compare the same criteria across both tools. Mark unverified information as unverified rather than filling every cell with assumptions.
Measure distinct outcomes. Track qualified organic clicks and conversions in your analytics. Evaluate relevant answer-engine mentions and citations separately where reliable observation is possible.
This is an illustrative workflow, not a claim that following it guarantees rankings or AI citations. Google’s guidance for AI search features still emphasizes useful, accessible, technically eligible content. My SEO content-brief template gives you a working research and editorial handoff, while the 2026 AI search statistics reference separates the available research from unsupported visibility promises.
When a separate GEO service is worth considering
A separate GEO engagement can be useful when a company already has a functioning search program but needs to audit whether its most important pages explain the product well enough for AI-assisted discovery. It can also make sense when a team is planning a major documentation, comparison, or category-content push and wants the research and evidence model designed properly from the start.
It is less useful when the basics are missing. A site with thin service pages, weak product explanations, no internal linking, and few credible sources does not need a new label. It needs the foundational work done well.
Questions to ask before buying GEO work
Which high-intent pages are already important to the business, and what evidence is missing from them?
Can the provider explain what they will measure beyond answer-engine mentions?
How will they check product claims, cite sources, and handle information that changes?
Will the work improve the page for a reader who never uses an AI answer engine?
Which part of the current search program is being replaced, and why?
Does GEO replace SEO?
No. It builds on the same requirement for useful, crawlable, accurate pages. It changes some of the research, evidence, and measurement questions around those pages.
Can anyone guarantee AI citations?
No. Search interfaces and models change, and a useful provider should be clear about that uncertainty.
Should every article have an FAQ for AI search?
No. Use an FAQ when it answers real remaining questions. A forced FAQ adds repetition rather than value.
The short version
SEO remains the foundation. GEO is a useful way to sharpen how a content program handles evidence, completeness, product context, and changing search behavior. The good work overlaps heavily.